Is Social Media Driving the Economy?
Social media is redefining the landscape of everything we do from the way we connect to family and friends, how brands and celebrities capture attention, to the way business and journalism function. Hundreds of millions of people across the world use social networks like Facebook, Twitter, and LinkedIn. If any technology promised to shatter the constraint of geography, overcome distance, and flatten the world, social media would be it.
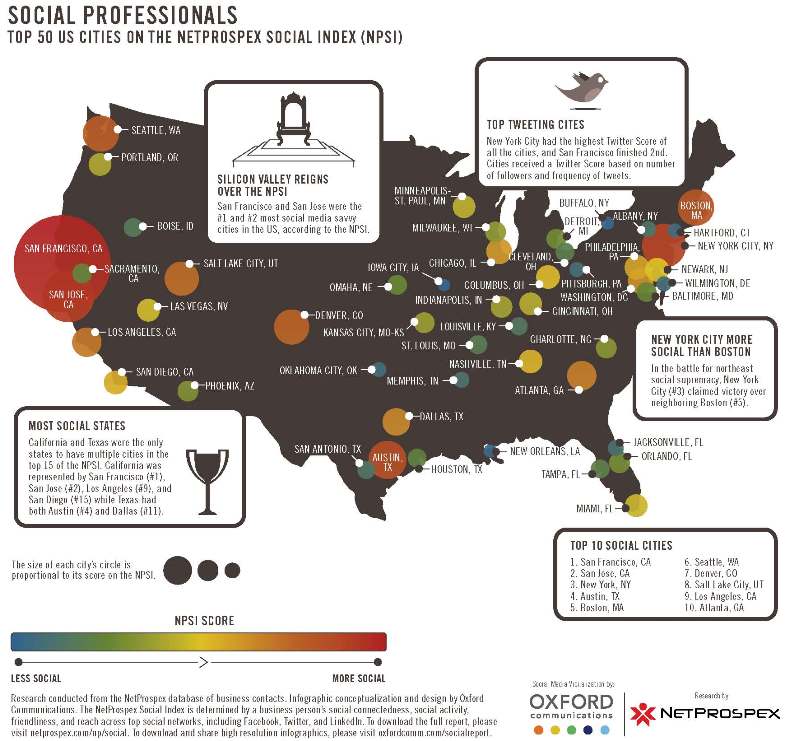
But a quick look at the map below, from the NetProspex 2010 Social Business Report, shows this is not the case at all, certainly not for the United States.
The map shows the 50 leading social media cities in the United States. It is based on data collected by NetProspex on social media adoption and used by more than two million business professionals.
The level of geographic concentration is pronounced, though the leading social media metros are not surprising. San Francisco, San Jose, and Silicon Valley, top the list, with New York City, Austin, Boston, Seattle, Denver, Salt Lake City, L.A., and Atlanta rounding out the top 10.
But what are the characteristics of America's leading social media centers? What factors are associated with its greater adoption and use in certain kinds of metros?
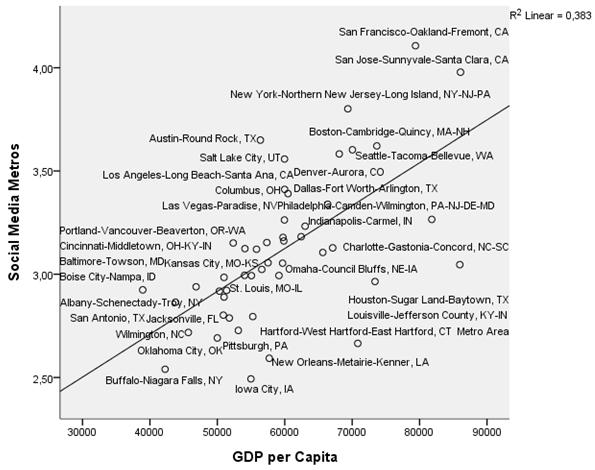
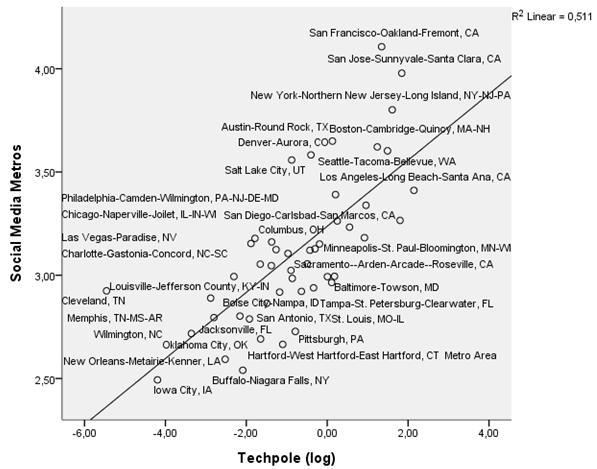
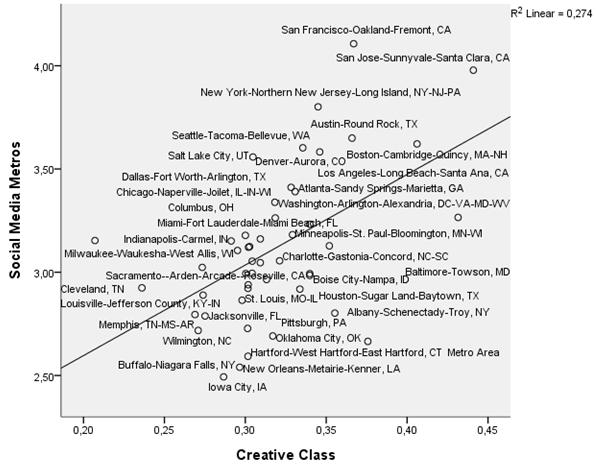
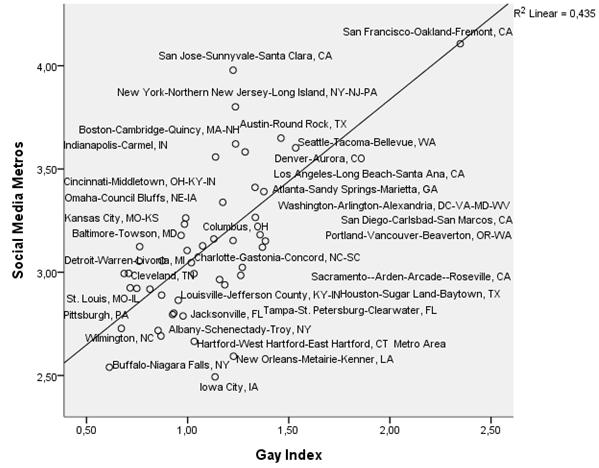
With the steady statistical hand of Charlotta Mellander, I decided to take a look at a range of factors that might be associated with geographic centers of social media. We examined key factors like economic development and income; clusters of high-tech industry; the human capital; creative class vs. working class job structures; the presence of artists, musicians, designers, and other artistic creatives; and openness to diversity and tolerance for immigrants and gays and lesbians (see the note on sources at the end of this post). We ran a basic correlation analysis and generated a series of scattergraphs plotting social media centers against these factors.
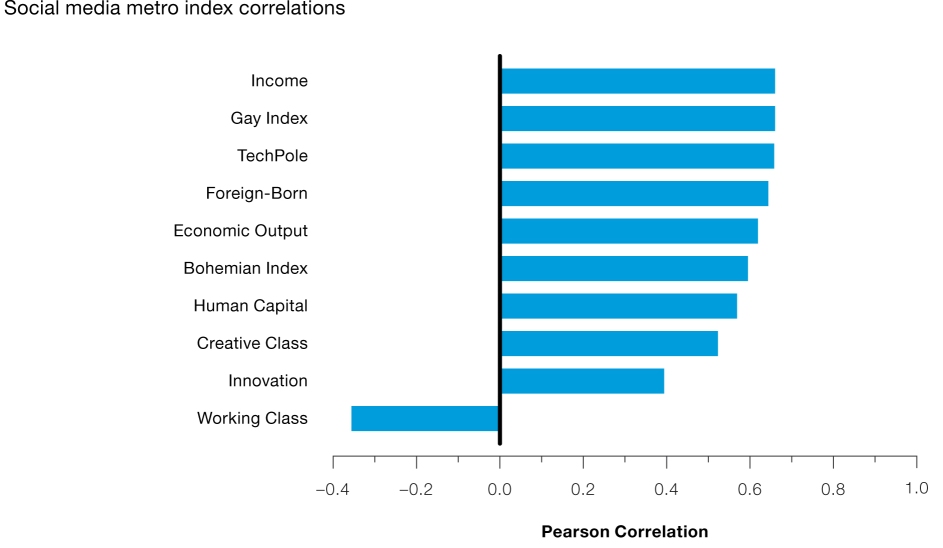
The chart above summarizes the key findings of our analysis. These are preliminary, exploratory analyses that simply point to associations between variables. We don't make any claims about the direction of causality, and we acknowledge that intervening variables may come into play. So what do we find?
Economic Development and Income: It stands to reason that the adoption of the use of social media at the city level would rise alongside local incomes and the overall level of economic development. And that is what we find. Social media is associated with both economic output and income. The correlations for each are substantial (in the range of .6 and .7).
High-Tech Industry and Innovation: It also stands to reason that social media would be more commonly used in places with higher levels of high-tech industry and higher rates of innovation. And again that is what we find. The correlation between social media centers and concentrations of high-tech industry is about the same as for economic development (ranging from .6 to .7). While social media at the city level is correlated with the rate of innovation, measured as patents, the correlation is more modest (about .4).
Human Capital: Social media use is also associated with higher levels of human capital, measured as the share of adults with a bachelor's degree or more education (with correlations in the range of .55 to .6).
Creative Class vs. Working Class: The class structure of the economy also seems to play a substantial role. Social media centers are also associated with higher concentrations of creative class jobs in fields like science and technology; business, management, and finance; arts, culture, and entertainment; and health care and education (with correlations in the range of .55). Social media centers are also significantly associated with artistic and cultural creatives specifically (with correlations ranging from .525 to more than .7). On the other hand, places with a larger blue-collar working class labor force tend to have lower concentrations of social media (with correlations ranging from .-3 to nearly -.4).
Openness to Diversity: I've long argued that openness to diversity -- measured either as openness to foreign-born people or to gay and lesbian populations -- reflects a place that is open to new ideas generally and enables outsiders to mobilize resources efficiently around these new ideas and firms. Open places benefit from low barriers to entry to talented people, and benefit from their ability to capture a greater flow of creative, innovative, and ambitious people. Both measures are closely associated with social media centers. Social media centers are closely associated both with the Gay Index -- a measure of the proportion of gays and lesbians in a metro area (with correlations ranging from .62 to nearly .7) - and the share of foreign-born people in a metro (with correlations of .6 and higher).
While social media allows us to connect instantaneously to people all over the globe, the geography of its professional use in the United States is concentrated. The leading social media metros in the U.S. are richer, more technologically advanced, have higher levels of education and higher levels of the creative class, and are more open to diversity of all sorts. The geography of social media thus both reflects and reinforces the increasingly uneven and spiky nature of America's economic landscape.
Notes on Data and Sources: Social media metros is from the NetProspex 2010 Social Business Report based on data on social media use by more than two million business professionals. The variable is logged in the scattergraphs above.
Economic Output is gross domestic product per capita and is from the Bureau of Economic Analysis. High-Tech is based on the Milken Institute's Techpole measure - regional high-tech intensity compared to national high-tech intensity updated with current data. Innovation is patents per capita and is from the U.S. Patent and Trademark Office.
Creative class includes the share of workers in science and technology; business, management, and finance; arts, culture, media, and entertainment; and health care and education. Working class includes the share of blue-collar workers in production occupations, maintenance, construction, and transportation. Bohemian Index is the share of adults in artistic and culturally creative occupations. These variables are from the Bureau of Labor Statistics.
Human capital is the share of adults with a bachelor's degree and above. Gay Index is the share of adults that are gay and lesbian and is based on research developed by Gary Gates and his collaborators. Foreign-born is the share of adults who were born outside of the United States. These variables are from the U.S. Census American Community Survey.
