
(T2108 measures the percentage of stocks trading above their respective 40-day moving averages [DMAs]. It helps to identify extremes in market sentiment that are likely to reverse. To learn more about it, see my T2108 Resource Page. You can follow real-time T2108 commentary on twitter using the #T2108 hashtag. T2108-related trades and other trades are sometimes posted on twitter using the #120trade hashtag. T2107 measures the percentage of stocks trading above their respective 200DMAs)
T2108 Status: 52.9%
T2107 Status: 49.7%
VIX Status: 15.1 (bouncing around pivot)
General (Short-term) Trading Call: Hold
Active T2108 periods: Day #49 over 20%, Day #8 above 30%, Day #7 over 40%, Day #5 over 50% (overperiod), Day #17 under 60%, Day #119 under 70%
Reference Charts (click for view of last 6 months from Stockcharts.com):
S&P 500 or SPY
SDS (ProShares UltraShort S&P500)
U.S. Dollar Index (volatility index)
EEM (iShares MSCI Emerging Markets)
VIX (volatility index)
VXX (iPath S&P 500 VIX Short-Term Futures ETN)
EWG (iShares MSCI Germany Index Fund)
CAT (Caterpillar).
Commentary
The Santa Claus rally is rolling along with more marginal new all-time highs on the S&P 500 (SPY).
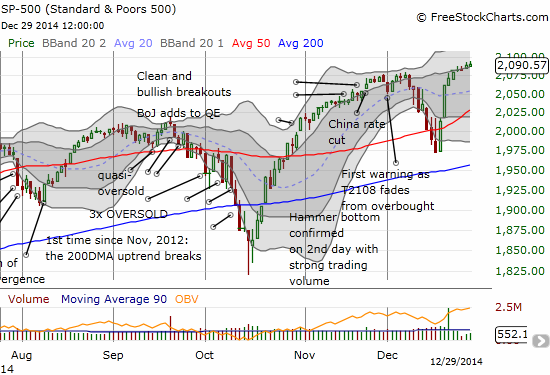
The post-Fed excitement is well behind the market, and it looks like it is meandering its way to the next catalyst. T2108 closed at 52.9% and is perfectly positioned in “neutral.” The volatility index bounced a little today but failed to hold its high at 16. It looks the VIX will bounce around the 15.35 pivot instead of continuing to collapse toward lows into the new year as I had hoped.
Speaking of expectations going into the new year, my title is a reference to two related items. First of all, I am completely avoiding the typical new year prognostication. Instead, I have chosen to steal an old friend’s mantra for making predictions: “prices will fluctuate.” It just seems to make little sense to project out an entire year when the vast majority of us will be flat wrong by the end of the year. I also do not like how some analysts and prognosticators spend a lot more time predicting than analyzing past claims.
More importantly, I am happy to announce that I have FINALLY updated the historical data for my T2108 Trading Model (TTM). Along the way, I found it necessary to give the presentation deck a series of uplifts and edits. I hope I have made the presentation at least a little easier to understand. As always, I welcome feedback.
The bottom-line for anyone without the inclination to dive into the dirty details is that the T2108 Trading Model has proven quite robust over these near two years since I first developed it. Nothing in the data over the last two years suggests I need to make dramatic changes in strategy or analysis. For folks new to the T2108 Trading Model, please refer to the Resource Page. Going forward I hope to more aggressively attack my list of potential future work:
- Consider inclusion of other technical indicators like T2104. T2104 is a Cumulative Volume Index which is an indicator of market breadth
- Further refine the quasi-oversold trading model and develop related derivatives
- Study drawdowns and risk in more detail
- Search for additional unique trading opportunities and windows: For example, the distance from a new 52-week or all-time highs, impact of other major indices, the prevailing trend, existence of recently tested price supports and resistance, etc…
- Continue searching for strict definitions of oversold and overbought conditions using T2108
- Test additional machine learning models
- Assess other moving averages for thresholds (is the 40DMA the best divider?)
Let me know whether there is anything missing from this list.
While I am making now 2015 predictions, I do have a few things I am KEENLY watching. Here is a SAMPLE:
Oil
Yes, EVERYONE is watching oil. My informal observation is that a LOT of folks are trying to pick a bottom. I can understand why: the eventual upside in buying oil-related stocks at a discount is potentially very high. But along the way could still deliver a lot of pain. After seeing oil make a fresh 5-year low, I pulled up the chart of Energy Select Sector SPDR ETF (XLE). I see an ETF ready to fail another test of resistance at its 50DMA.
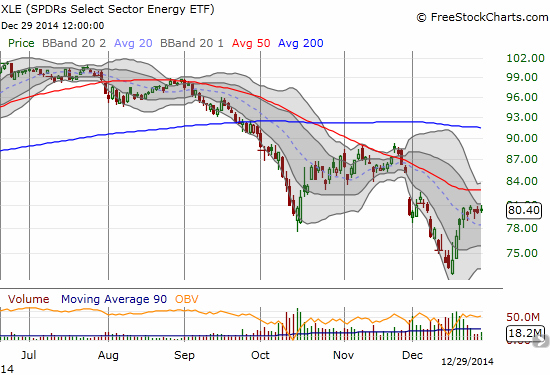
Instead of shorting XLE directly, I decided to try a leveraged ETF instead: Direxion Daily Energy Bear 3X ETF (ERY). Its chart is perfectly perched on 50DMA SUPPORT. The additional reason why I like re-shorting oil here is that IF the S&P 500 has another rough January, it will almost certainly take down oil-related stocks as well. Thus, ERY becomes a fresh hedge on my overall bullishness. Mind you, out of the other side of my neck I HAVE been nibbling on some oil-related names in the past two weeks. I made a first tranche of buys in Encana (ECA) – an old favorite; Memorial Production Partners LP (MEMP) – a high-yielder that I discovered already hedged itself 5 years out (thank you Nightly Business Report!); and Fluor Corporation (FLR) – an infrastructure play I have LONG wanted to add to the portfolio. I have absolutely no interest in rushing into a second tranche until some signs of stabilization and/or further decline in sentiment occurs in the sector.
The buy of ERY may have been timely given the following warning from Civeo Corporation (CVEO) in after hours (emphasis mine):
“Civeo Corporation (NYSE:CVEO) today announced the company’s initial 2015 guidance, which reflects decisions by major oil companies in North America to significantly reduce 2015 capital spending, particularly in Canada, continuing weakness in global commodity markets and the resulting impact on the company’s business in Canada, Australia and the United States.
The acceleration in November of the decline in global crude oil prices and forecasts for a potentially protracted period of lower prices have resulted in major oil companies reducing their 2015 capital budgets from 2014 levels. This has had the effect of reducing the near-term allocation of capital to development or expansion projects in the oil sands, which is a major driver of demand for the company’s services in Canada. It has also increased the difficulty of reliably estimating 2015 occupancy levels for the company’s facilities. Likewise in Australia, persistently low metallurgical coal prices continue to negatively impact demand for accommodations in Civeo’s primary markets. In addition to these operational factors, the company expects to be negatively impacted by the continuing weakness in the Canadian and Australian dollars, which are down 2% and 6%, respectively, over the past two months against the US dollar and down 8% and 9%, respectively, year-to-date in 2014.”
This alone says that oil companies are NOT expecting some kind of quick rebound in 2015. To make matters look even more dire, CVEO is now in search of NEW revenue sources!
“In reaction to softer markets, the company is pursuing additional revenue opportunities, adjusting its cost structure, limiting capital expenditures and suspending its quarterly dividend.”
Consider ourselves warned.
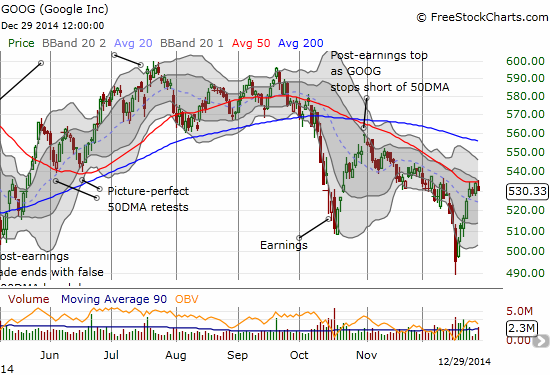
Google (GOOG)
GOOG experienced a surprisingly sharp plunge below the $500 level during the last brief market sell-off. Unsurprisingly, the bounceback was equally sharp (and yet somehow I missed the entire move!). Now, GOOG is struggling to break 50DMA resistance. I am expecting it to fail as it seems GOOG is experiencing a very slow but sure downward shift in sentiment. I am ready to trigger a related trade on a break of $525 which would take the stock below recent (low-volume) churn. Note that a breakout should at least have enough power to re-challenge the post-earnings high from October…which will coincidentally converge with 200DMA resistance.
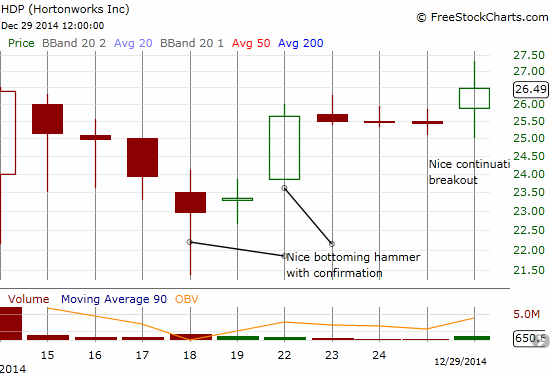
IPOs
My friend TraderMike has (re)opened my eyes to the wonderful word of IPOs. There are all sorts of stocks making amazingly nice trading opportunities from a technical level. I am pledging myself to watch his site swingtradebot more carefully. YOU should too! Here is an example of a very nice setup in Hortonworks (HDP) that I completely missed…
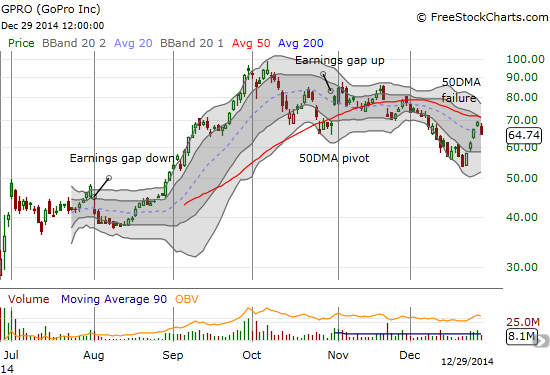
GoPro, Inc. (GPRO)
This is a recent IPO that deserves its own section. Little has spelled hype better than GPRO’s IPO and subsequent run-up. But the stock has fallen hard from all-time highs and momentum has come to an abrupt halt. NOW, the 50DMA is starting to define a downtrend in the making. Note how GPRO definitively failed 50DMA resistance today. I took the opportunity to run into some put options.
Currencies
This deserves its own post. Suffice to say that I continue to monitor the major themes going: strong dollar, weak euro, shaky Australian dollar, the stalled economic recovery for the United Kingdom (British pound), the shredding of the Japanese yen from immense amounts of central bank printing, contrarian long the Canadian dollar
The Commodity Crash Playbook
I first developed this concept in 2011. I am looong overdue to update it and rewrite the playbook as commodities across the board have finally collapsed in 2014.
Solar Stocks
Earlier this month, I dared to prognosticate a January bounce in solar stocks. I had a good round of first positions in December. I am rebuilding a hedged play for January. I will write a separate post on it soon. In the meantime, here is how I am generally playing it: long First Solar (FSLR) call options, short Guggenheim Solar ETF (TAN), short Canadian Solar Inc. (CSIQ), and long CSIQ call options. I may make additional tweaks in the coming days.
Hmmm….looking at my list, it sure looks pretty bearish! Something to chew on, I guess.
Happy New Year. Let’s make this one another good one! Thanks to all of you for your support and readership.
Daily T2108 vs the S&P 500
")
Black line: T2108 (measured on the right); Green line: S&P 500 (for comparative purposes)
Red line: T2108 Overbought (70%); Blue line: T2108 Oversold (20%)
Weekly T2108

*All charts created using freestockcharts.com unless otherwise stated
The T2108 Resource Page
Expanded daily chart of T2108 versus the S&P 500
Expanded weekly chart of T2108
Be careful out there!
Full disclosure: long ERY, long UVXY puts, long GPRO puts and calls, net long U.S. dollar, short Australian dollar, short euro, net long yen, long British pound
Hi Dr. Duru,
I get a lot out of your posts, and really value your insight.
THANK YOU for taking the time to continually write this blog!
Thanks for the feedback and thanks for reading!