
(T2108 measures the percentage of stocks trading above their respective 40-day moving averages [DMAs]. It helps to identify extremes in market sentiment that are likely to reverse. To learn more about it, see my T2108 Resource Page. You can follow real-time T2108 commentary on twitter using the #T2108 hashtag. T2108-related trades and other trades are posted on twitter using the #120trade hashtag)
T2108 Status: 66.5%
VIX Status: 13.8
General (Short-term) Trading Call: Short (bearish bias).
Active T2108 periods: Day #139 over 20%, Day #14 over 60% (overperiod), Day #1 under 70% (ending 1-day overbought period)
Reference Charts (click for view of last 6 months from Stockcharts.com):
S&P 500 or SPY
SDS (ProShares UltraShort S&P500)
U.S. Dollar Index (volatility index)
EEM (iShares MSCI Emerging Markets)
VIX (volatility index)
VXX (iPath S&P 500 VIX Short-Term Futures ETN)
EWG (iShares MSCI Germany Index Fund)
CAT (Caterpillar).
Commentary
Well that was fun.
T2108 finally hit overbought yesterday (Wednesday, January 22, 2014), but could only hold for a day. I will likely look back on this day as an important close call as I stuck to my bearish bias ONLY because the S&P 500 had not yet broken away from the bear/bull zone. Now, my puts on ProShares Ultra S&P500 (SSO) are just about back to flat. To be clear, IF the S&P 500 had closed just a few points higher, I would have switched my bias to bullish and prepared for an extended overbought rally. That could still happen in a few days, but I suspect there is a lot stiffer overhead resistance now.
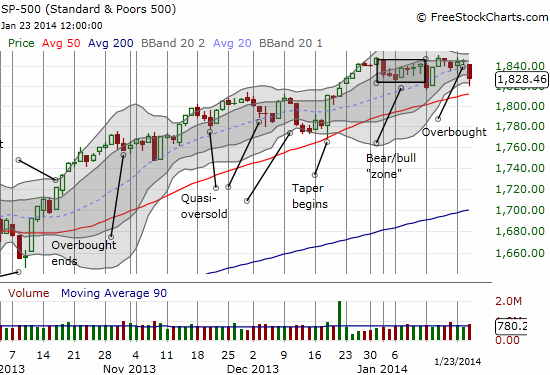
The size of the pullback surprised me. The S&P 500 only pulled back 0.89%, but listening to CNBC you would have sworn the market was practically in the throes of a freefall. Suddenly, China is weighing the entire planet down and dragging us into a new recession….all because the China flash PMI came in at 49.6 overnight, dipping marginally into contraction territory. iShares China Large-Cap (FXI) felt the body blow…
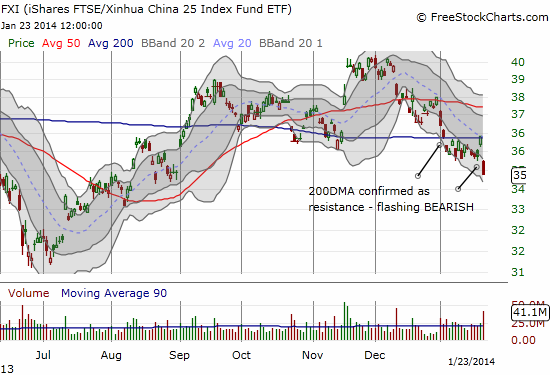
FXI fell 4.5% on the day on relatively high volume. With a double failure at 200DMA resistance, FXI is a clear short trade now (stop just above the last consolidation). The truly intriguing breakdown is in Aussie-yen, AUD/JPY. The Australian dollar (FXA) was hit hard in multiple waves after the China PMI. The Japanese yen strengthened against all major currencies, even the stubborn euro (FXE). The combination AUD/JPY took a hit that continues at the time of writing.
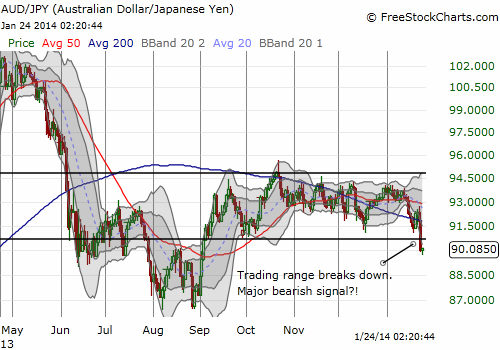
At the end of last year, I wrote “The Australian Dollar And Japanese Yen Enter 2014 Joined At The Hip – A Split Could Be Telling” and said the following:
“As 2014 unfolds, I will be watching closely to see whether the resolution of AUD/JPY’s tight range comes with a new correlation with the S&P 500. In particular, if AUD/JPY manages to break away higher, the recent history says that the S&P 500 is very likely to move higher in parallel…or in due time. A downward resolution for AUD/JPY will be a red flag awaiting confirmation.
The chart below suggests that current cycle of little to no correlation is roughly halfway finished. So, an approximate target for observing increasing correlation again is late January to mid-February.”
And here we are. Not quite late January, but it seems the “decision” is for a bearish breakdown. With a fall in the S&P 500 that is freaking out a lot of people and an FXI that truly is breaking down, I think I am seeing confirmation of an actual bearish episode for the stock market. However, bears and sellers have lacked follow-through for a long time. Note that the S&P 500 did not even close at its lows; the small bounce pulled the index right back inside the bear/bull zone. While my bias remains bearish, I cannot get too excited until the index demonstrates a convincingly bearish close below the bear/bull zone and THEN follows through to a close below the nearby 50DMA.
While we wait, two quick chart reviews: Netflix (NFLX) and F5 Networks (FFIV).
Netflix (NFLX) practically followed the post-earnings script I laid out yesterday. As a reminder, here is a snippet…
“While Carl Icahn will likely use this fresh gift to once again sell shares into the increased liquidity generated by post-earnings reactions, I do NOT think it is as clear a shorting opportunity as the last post-earnings response. Last time, NFLX soared almost 12% above its upper-Bollinger Band (BB). That move is about as over-extended as they come! This time, NFLX will be trading just above the upper-BB. Do not be surprised to see additional momentum before the stock pulls back for a rest.”
Even though I suspected it was too good to be true, I bought NFLX on the first pullback from the open. Thirty minutes or so later, I was up 15 points and out the trade. The stock spent the rest of the day drifting, first toward the lows on the day and then a small bounce. I still maintain that NFLX is NOT to be shorted here. If you are extremely bearish on the stock, at least wait until it flashes a sign like a firm close below today’s low (around $377).
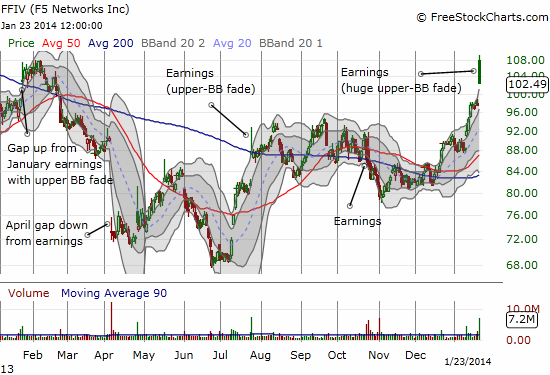
F5 demonstrated what a good post-earnings fade looks like. The stock gapped up 8% above its upper-Bollinger Band (BB) (sound familiar?). The stock never looked back. It closed on its low of the day as sellers just kept mercilessly ringing the register. Since presumably FFIV reported strong earnings, advantage stays with the buyers. A lower risk buy is to try to wait at least for the stock to tag the upper-BB…and even then buy “half” a position. Stop out if FFIV completely closes the gap and keeps selling from there.
I completely missed the fade on FFIV because I was too focused on NFLX…and Apple (AAPL) (of course)! I hope to write a pre-earnings review for Apple over the weekend. Until then…!
Daily T2108 vs the S&P 500
")
Black line: T2108 (measured on the right); Green line: S&P 500 (for comparative purposes)
Red line: T2108 Overbought (70%); Blue line: T2108 Oversold (20%)
Weekly T2108

*All charts created using freestockcharts.com unless otherwise stated
Related links:
The T2108 Resource Page
Expanded daily chart of T2108 versus the S&P 500
Expanded weekly chart of T2108
Be careful out there!
Full disclosure: long SPHB and SPLV and SSO puts; long AAPL shares, calls, and puts; bearish bias on the Australian dollar and Japanese yen (still long AUD/JPY for now); net short euro