
(T2108 measures the percentage of stocks trading above their respective 40-day moving averages [DMAs]. It helps to identify extremes in market sentiment that are likely to reverse. To learn more about it, see my T2108 Resource Page. You can follow real-time T2108 commentary on twitter using the #T2108 hashtag. T2108-related trades and other trades are posted on twitter using the #120trade hashtag)
T2108 Status: 71.6% (first overbought day)
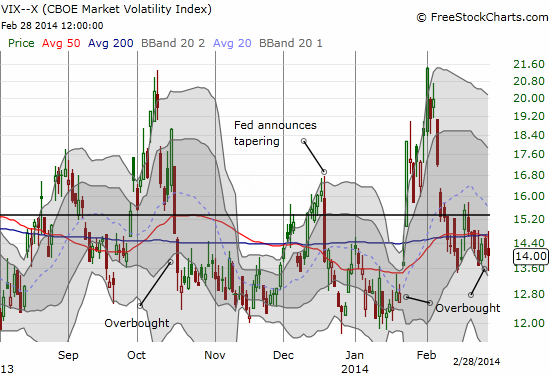
VIX Status: 14.0 (flat with previous day)
General (Short-term) Trading Call: Short (weak bearish bias – see caveats below)
Active T2108 periods: Day #164 over 20%, Day #10 over 60%, Day #1 over 70% (overperiod)
Reference Charts (click for view of last 6 months from Stockcharts.com):
S&P 500 or SPY
SDS (ProShares UltraShort S&P500)
U.S. Dollar Index (volatility index)
EEM (iShares MSCI Emerging Markets)
VIX (volatility index)
VXX (iPath S&P 500 VIX Short-Term Futures ETN)
EWG (iShares MSCI Germany Index Fund)
CAT (Caterpillar).
Commentary
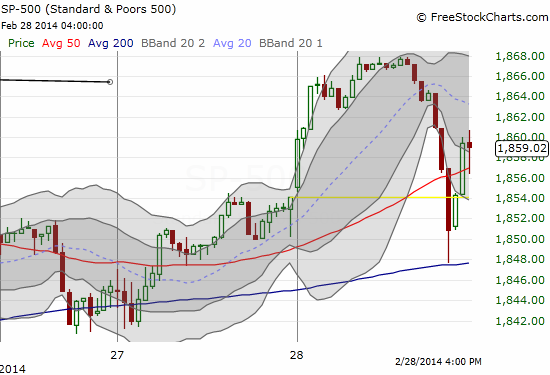
After a series of close calls, T2108 FINALLY flipped overbought. It closed February at 71.6% with the S&P 500 setting a fresh all-time high.
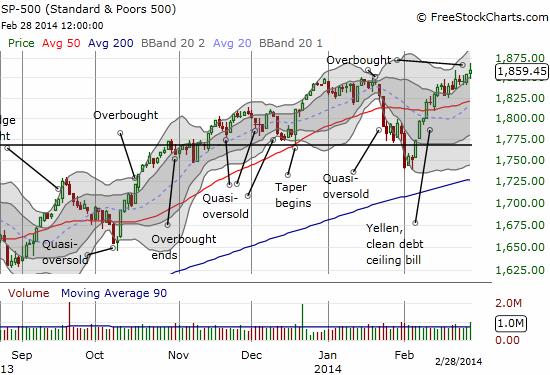
Note VERY well that the S&P 500 just barely closed out February with its all-time high as headlines about the on-going troubles in Ukraine apparently sent the market reeling into the close. A rush of buyers in the final 45 minutes or so saved the day. Also interesting was how T2108 bounced off of the overbought threshold (70%) during this episode.
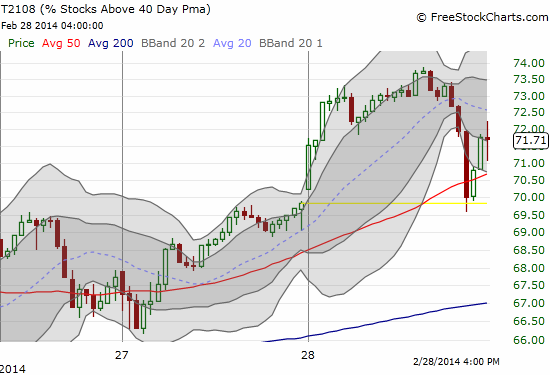
When I saw this pullback I was quick to send out a tweet relating this action to January 22, 2014 where T2108 closed overbought only to find itself, and the S&P 500, sharply tumbling the next day. My alarm may have been premature, but I still consider this overbought status to be very tentative. Thus, my trading bias remains at bearish, albeit weaker than before. The coming first trading day of the month may give traders a good glimpse of what is to come in the next weeks. I flip to bullish with a solid close above Friday’s intraday high. At such a point, I will re-examine the case for an extended overbought rally.
The volatility index, the VIX, gives me another reason for hesitation. It has not yet “conceded” a fresh bullish phase in the market. The chart below shows the last three overbought dates. The current overbought conditions sit smack in the middle of the previous two. The October overbought point was firmly bullish as the VIX was in the middle of a steep slide. It drifted downward for the next month as the S&P 500 churned slowly higher. The January overbought condition came in the middle of a VIX consolidation very similar to the current one. The market has an excuse in Ukraine, so we should stay alert for a sharp reversal similar to what happened in late January. If it comes, I will of course look for a point to start fading volatility even as I cling to my same old tranche of ProShares Ultra S&P500 (SSO) puts.
Two final reminders: 1) March is one of the least volatile months of the year, and 2) home builder stocks are breaking out, and I find it VERY difficult to get too bearish under such conditions!
Daily T2108 vs the S&P 500
")
Black line: T2108 (measured on the right); Green line: S&P 500 (for comparative purposes)
Red line: T2108 Overbought (70%); Blue line: T2108 Oversold (20%)
Weekly T2108

*All charts created using freestockcharts.com unless otherwise stated
Related links:
The T2108 Resource Page
Expanded daily chart of T2108 versus the S&P 500
Expanded weekly chart of T2108
Be careful out there!
Full disclosure: long SSO puts